Die BGR führte eine flächenhafte Befliegung bei Finsterwalde (Brandenburg) im Rahmen des BGR-Projektes D-AERO-Finsterwalde durch. Es handelte sich hierbei um eine Pilotstudie zur Erkundung der "Finsterwalder Restlochkette" mit dem Aerogeophysik-Standardmesssystem der BGR. Das ehemalige Braunkohlebergbaugebiet liegt zwischen Finsterwalde und Lauchhammer in der Niederlausitz, etwa 50 km südwestlich von Cottbus. Die Gebietsgröße beträgt etwa 250 km². 8 Messflüge mit einer Gesamtprofillänge von 1263 km (298.642 Messpunkte) wurden zur Abdeckung des gesamten Messgebiets benötigt. Der Sollabstand der 107 NW-SO-Messprofile war 250 m, der Sollabstand der 35 NO-SW-Kontrollprofile variierte und lag bei 625-3125 m. Die beiden ASCII-Datendateien beinhalten die Rohdaten sowie die prozessierten HEM-Daten zu jeweils sechs Messfrequenzen (0,4 - 130 kHz).
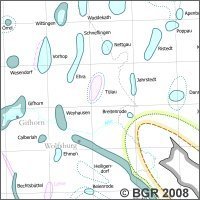
Neue Karte der Salzstrukturen in Norddeutschland im Maßstab 1:500.000, einschließlich des deutschen Anteils der Nordsee (mit "Entenschnabel"). Die Karte enthält alle Salzstrukturen in diesem Gebiet, unterschieden in Salzstöcke, Salzkissen und Salzintrusionen. Die Salzstöcke zeigen den Maximalumfang und sind differenziert in solche, auf denen die Unterkreidebedeckung oder ältere Sedimente noch erhalten sind und solche, auf denen diese unter jüngeren Sedimenten fehlen. Die Salzkissen werden unterschieden in Zechsteinsalz-, Keupersalz- und Oberjurasalz-Kissen. Zusätzlich dargestellt sind: die Verbreitung der Zechstein-Diapire, die Verbreitung des Zechsteinsalinars, die Verbreitung der Rotliegendsalinar-Strukturen und die Bezeichnung der Strukturen. Vier Schnitte deuten die morphologische Vielfalt der Salzstrukturen an, eine Literaturauswahl gibt Hinweise für weitergehende Recherchen zu verschiedenen wissenschaftlichen Themen über Salzstrukturen. Die Karte basiert auf den Resultaten des in der BGR erstellten Geotektonischen Atlas, dem Geophysikalischen Kartenwerk der DDR bis 1989 sowie davon abgeleiteten Arbeiten. Weiterhin sind aktuell durch BGR erhobene Daten im Bereich der Nordsee berücksichtigt.
Die BGR führte eine flächenhafte Befliegung im Raum des Stassfurt-Egelner Sattels als Teil eines BMBF-Forschungsverbundvorhabens "Dynamik abgesoffener oder gefluteter Salzbergwerke und ihres Deckgebirgsstockwerks" durch. Das Messgebiet Stassfurt (2007) wird umrandet durch die Städte und Gemeinden Aschersleben, Kroppenstedt, Hadmersleben, Altenweddingen, Atzendorf, Förderstedt und Bernburg. Die Gebietsgröße beträgt etwa 467 km² und 29 Messflüge mit einer Gesamtprofillänge von 5131 km (1.305.181 Messpunkte) wurden zur Abdeckung des gesamten Messgebiets benötigt. Der Sollabstand der 161 SO-NW-Messprofile beträgt 100 m, der Sollabstand der 33 NO-SW-Kontrollprofile beträgt 1000 m. Die ASCII-Datendatei beinhaltet die Rohdaten sowie die prozessierten HMG-Daten.
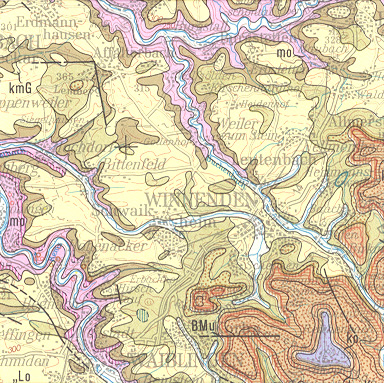
Blatt Stuttgart-Nord wird nahezu vollständig von der Süddeutschen Schichtstufenlandschaft eingenommen. In der Nordwest-Ecke des Kartenausschnitts ist der südliche Teil des Odenwaldes erfasst. Im Bereich der Süddeutschen Schichtstufenlandschaft bildeten sich durch Verwitterung und Abtragung flach einfallender Sedimentformationen des Mesozoikums (Muschelkalk bis Malm) charakteristische Schichtstufen heraus. Von Südost nach Nordwest lässt sich folgende Gesteinsabfolge festhalten: In der Südost-Ecke des Kartenblattes sind Lias und Dogger der Schwäbischen Alb angeschnitten, denen in nordwestliche Richtung Keuper-, Muschelkalk- und Buntsandstein-Sedimente folgen. In den Niederungen und Senken, speziell in der Heilbronner Mulde, wird das Mesozoikum von pleistozänem Löss überlagert. Am Westrand des Kartenausschnitts, südlich von Heidelberg, ist das Schollengebiet der Kraichgau erfasst. Mit Einbruch des Oberrheingrabens im Tertiär bildeten sich neben den Hauptverwerfungen parallel angeordnete Störungslinien und Schollentreppen heraus. Auf engem Raum sind hier neben Muschelkalk, Keuper, Lias und Dogger auch känozoische Lockersedimente zu finden. Die ältesten Gesteine stehen in der Nordwest-Ecke des Kartenblattes, im Odenwald, an. Sein westlicher Teil setzt sich aus metamorphen und magmatischen Gesteinen des Paläozoikums bzw. Präkambriums zusammen. Bei den Metamorphiten dominieren Gneise und Amphibolite. Bei den Magmatiten handelt es sich um saure bis basische Plutonite (Granit, Granodiorit Diorit) sowie spätvariszische Vulkanite (Rhyolithe und Rhyolithtuff). Der Ostteil des Odenwaldes besteht im Gegensatz dazu aus Sand- und Tonsteinen des Buntsandsteins. In der Umgebung des Odenwaldes beißen Zechstein-Sedimente im Flusslauf von Neckar und Laxbach aus. Neben der Legende, die über Alter, Genese und Petrographie der dargestellten Einheiten informiert, gewährt ein geologischer Schnitt zusätzliche Einblicke in den Aufbau des Untergrundes. Die Profillinie beginnt im Kristallin des Odenwaldes und quert in Südost-Richtung die Süddeutsche Schichtstufenlandschaft, wobei das Neckartal, die Heilbronner Mulde, die Neckar-Jagst-Furche, das Murrtal und der Rudersberg gekreuzt werden.
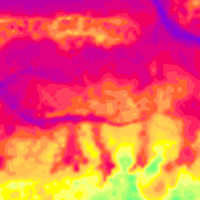
Die BGR führte im Projekt „Deutschlandweite Aerogeophysik-Befliegung zur Kartierung des nahen Untergrundes und seiner Oberfläche“ (D-AERO) flächenhafte Befliegungen an der deutschen Nordseeküste durch. Das Messgebiet Esens (2008/09) wird etwa durch die Ortschaften Aurich und Dornum im Westen sowie Wittmund und Werdum im Osten begrenzt. Die Gebietsgröße beträgt etwa 370 km² und 23 Messflüge mit einer Gesamtprofillänge von 1542 km (437.562 Messpunkte) wurden zur Abdeckung des gesamten Messgebiets benötigt. Der Sollabstand der 75 N-S-Messprofile beträgt 250 m, der Sollabstand der 8 W-O-Kontrollprofile beträgt 2000 m. Die Karten stellen die aus HEM-Daten zu sechs Messfrequenzen (0,4 - 130 kHz) abgeleiteten geophysikalischen Parameter scheinbarer spezifischer Widerstand und Schwerpunktstiefe dar. Ferner sind aus den berechneten Schichtmodellen (spezifische Widerstände und Mächtigkeiten für sechs Schichten) Horizontalschnitte und Vertikalschnitte erstellt worden.
Allgemeine Geschäftsbedingungen, siehe https://www.bgr.bund.de/AGB - General terms and conditions, see https://www.bgr.bund.de/AGB_en. Die bereitgestellten Informationen sind bei Weiterverwendung wie folgt zu zitieren: Datenquelle: 129EsensHEM, (c) BGR, Hannover, 2016, doi:10.25928/bgr129hem_nw07-c538
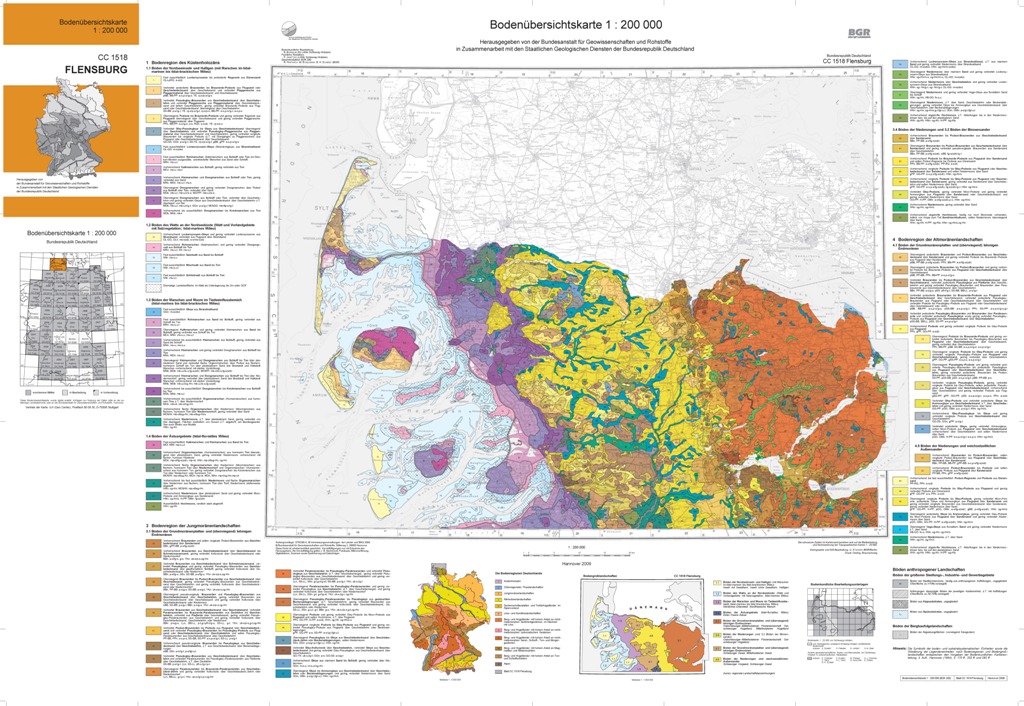
Die Bodenübersichtskarte 1:200.000 (BÜK200) wird von der Bundesanstalt für Geowissenschaften und Rohstoffe (BGR) in Zusammenarbeit mit den Staatlichen Geologischen Diensten (SGD) der Bundesländer im Blattschnitt der Topographischen Übersichtskarte 1:200.000 (TÜK200) erarbeitet und in 55 einzelnen Kartenblättern herausgegeben. Die digitale, blattschnittfreie Datenhaltung bildet eine detaillierte, bundesweit einheitliche und flächendeckende Informationsgrundlage für Länder übergreifende Aussagen zu Bodennutzung und Bodenschutz. Über den aktuellen Bearbeitungsstand des Kartenwerks informieren die Internetseiten der BGR zum Thema Boden. Die Verbreitung und Vergesellschaftung der Böden auf dem Gebiet dieses Kartenblattes wird anhand von 93 Legendeneinheiten (gegliedert nach Bodenregionen und Bodengroßlandschaften) beschrieben. Jede Legendeneinheit beinhaltet bodensystematische Informationen (Bodensubtyp) und Informationen zum Bodenausgangsgestein sowohl für die Leitböden als auch für deren Begleiter. Inklusive Blatt CC1510 Westerland und einem kleinen Teil von Blatt CC1526 Fehmarn.
Allgemeine Geschäftsbedingungen, siehe https://www.bgr.bund.de/AGB - General terms and conditions, see https://www.bgr.bund.de/AGB_en. Die bereitgestellten Informationen sind bei Weiterverwendung wie folgt zu zitieren: Datenquelle: BÜK200 CC1518 V1.0, (C) BGR, Hannover, 1999.
This data set builds upon the broadband detection lists of the International Monitoring System (IMS)’s infrasound stations. The infrasound data of these stations are regularly (re-)processed at the German National Data Centre at BGR (e.g., Ceranna et al., 2019; https://doi.org/10.1007/978-3-319-75140-5_13) using the Progressive Multi-Channel Correlation (PMCC) array processing method (Cansi, 1995; https://doi.org/10.1029/95GL00468). The latest reprocessing with 26 one-third octave spaced frequency bands in the IMS band of interest (0.01 to 4 Hz) included all 53 stations that were certified within the period 2003 to 2020. Based on the resulting broadband detection lists, this data set expands on former analyses of the coherent ambient noise. For each station with a data availability of at least one year (by the end of 2020), monthly reference histograms for the detection parameters back azimuth, apparent speed, and root-mean-squared amplitude are provided. The histograms provide a means to determine the deviation from nominal monthly behaviour and thus enable assessing the plausibility of detections and potential anomalies – without determining their cause – in the detected parameters. Overall, these quality metrics will be, among other applications, a useful supplement to the open-access IMS infrasound data products provided by Hupe et al., which are also available in BGR’s product centre. Further details of the reference histograms are described in the following publication by Kristoffersen et al.: "Updated global reference models of broadband coherent infrasound signals for atmospheric studies and civilian applications" (https://doi.org/10.1029/2022EA002222).
Licence: CC BY 4.0; in the event of further use, both the data product source and the accompanying open-access publication (Kristoffersen et al., 2022; doi: 10.1029/2022EA002222) should be cited. Lizenz: CC BY 4.0; bei Weiterverwendung sind sowohl die Datenproduktquelle als auch die zugehörige open-access Publikation (Kristoffersen et al., 2022; doi: 10.1029/2022EA002222) zu zitieren.
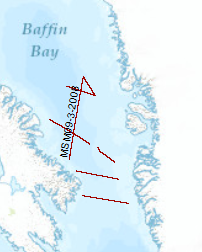
The cruise leg MSM09/3 was conducted as a cooperative project between the Alfred Wegener Institute for Polar and Marine Research (AWI), the Federal Institute for Geosciences and Resources (BGR), the Geological Survey of Denmark and Greenland (GEUS) and Dalhousie University. The data format is Society of Exploration Geophysicists SEG Y. A geophysical survey covered areas of Baffin Bay and Davis Strait between Greenland and the Canadian Baffin Island. A component of the IPY 2007/08 Lead Project Plate Tectonics and Polar Gateways in the Earth System (PLATES & GATES), this project DAVIS GATE is aimed to develop a tectonic and sedimentary reconstruction of the opening process of this oceanic gateway. Baffin Bay and Davis Strait play an important role in the shallow water exchange from the Arctic to the Atlantic Ocean. The plate-tectonic evolution as well as the magmatic history of this region has been sparsely known and required a careful geophysical investigation in order to construct a set of gridded detailed paleotopographic maps for a complete geodynamic reconstruction of this gateway. With a set of three seismic refraction/wide-angle reflection profiles, using ocean-bottom seismometers on 62 stations, as well as multi-channel reflection seismic recordings with a 3000-m long streamer, data were acquired from the sedimentary cover to the deep crust and even from parts of the uppermost mantle. Additional seismic data supplement these profiles and provide insights into the structures of the basement and dominant fault zones such as the Ungava fault system. A parallel running magnetic survey aimed to resolve the temporal evolution of the oceanic crust of Baffin Bay. The extension and subsidence of the continental and transitional crust in the Davis Strait and the evolution of oceanic crust in the Labrador Sea and Baffin Bay could be investigated with dataset to which continuously recorded gravity anomaly data and sub-bottom profiler data also contribute. This dataset provides the basis of geometrical and physical properties of the crust required for a realistic geodynamic model which will describe the break-up and the ocean basin evolution between Greenland and Canada in terms of detailed paleo-topography.
Allgemeine Geschäftsbedingungen, siehe https://www.bgr.bund.de/AGB - General terms and conditions, see https://www.bgr.bund.de/AGB_en. Die bereitgestellten Informationen sind bei Weiterverwendung wie folgt zu zitieren: Datenquelle: BGR08, (c) BGR, Hannover, 2008
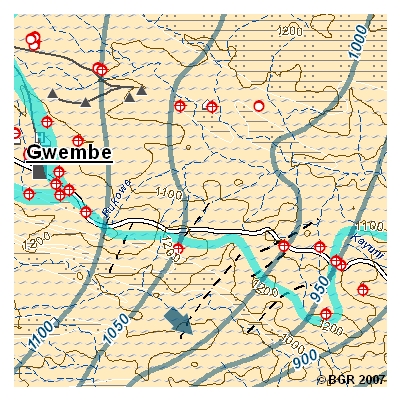
In Sambia steigt der Bedarf an Trink- und Nutzwasser ständig an. Die sambische Regierung kooperiert im Wassersektor mit der BGR als einer der Durchführungsorganisationen der bilateralen Technischen Zusammenarbeit. Innerhalb des Projektes "Grundwasserressourcen für die Südprovinz" werden Lösungskonzepte für die südlichen Landesteile erarbeitet, in denen Oberflächenwasser knapp und nicht ganzjährig verfügbar ist. Die Gewährleistung eines integrierten, nachhaltigen Managements der nationalen Grundwasserressourcen setzt voraus, dass genügend Informationen über die verfügbaren Mengen und Qualitäten sowie des Oberflächen- als auch des Grundwassers vorhanden sind. Ein Ergebnis der Datenrecherche ist die GIS-basierte Hydrogeologische Karte der Südprovinz Sambias, Blatt "Northern Kariba Lake and Kafue Gorge" im Maßstab 1:250.000. Die Karteninhalte setzen sich wie folgt zusammen: - Topographie; Administrative Grenzen, Verkehr, Siedlungen, Gesundheitscenter, Schulen, Relief und Gewässersystem mit Feuchtgebieten - Oberflächenwassereinzugsgebiete - Grundwassergleichen und -richtung - Aquifere - Lithologie und geologische Strukturen - Bohrlöcher, Brunnen und Quellen - Nebenkarte: Niederschlag - Indexkarte: existierende Hydrogeologische Karten der Südprovinz Sambias (Maßstab 1:100,000) Hinweis: Zusätzlich stehen 2 weitere hydrogeologische Karten der Südprovinz im Maßstab 1:250.000 und eine Karte im Maßstab 1:100.000 sowohl digital als auch gedruckt zur Verfügung. Die gedruckte Version ist nur im Gesamtpaket (4 Karten mit 2 Beiheften) erhältlich.
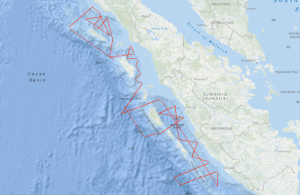
The SUMATRA cruise SO189 Leg 1, aboard the RV SONNE, was carried out off Sumatra between 3rd August and 3rd September 2006, with mobilisation in Penang, Malaysia and demobilisation in Jakarta, Indonesia, respectively. The survey was dedicated to marine geophysical measurements and acquired multichannel seismic data (MCS) using a 240 channel streamer, and a tuned airgun array comprising 16 airguns with a total capacity of 50.8 litres. Bathymetry data, using the 12 kHz Simrad swath system, sub-seabed data using the hull mounted high resolution PARASOUND profiler together with gravity (G) and magnetic (M) data were also acquired. Along two lines with a total length of ~ 390 km refraction/wide-angle seismic experiments were carried out. During the survey a total of 4,375 line kilometres of MCS, M and G data were acquired and an additional 990 km with M and G alone. The 41 MCS lines cover as close grid three fore-arc basins. Five lines extend nearly orthogonal to the subduction front and, thus, cover the whole subduction system from the adjacent oceanic plate, the trench and accretionary prism over the Outer Arc High to the forearm basins offshore Sumatra. The survey was planned using the bathymetry from the HMS SCOTT, RV NATSUSHIMA, RV MARION DUFRESNE and RV SONNE cruises carried out in 2004, 2005 and 2006. The main scientific objective of the project SUMATRA is to determine or estimate the hydrocarbon (HC) system (source rocks, HC generation, HC migration and reservoir rocks) of the Sumatra fore-arc region (mainly the fore-arc basins). Cruise SO189 Leg 1 was designed to investigate the architecture, sedimentary thickness, sedimentary evolution and subsidence history of the fore-arc basins Siberut, Nias and Simeulue off Sumatra. In the Simeulue Basin it was possible to connect the seismic lines to three industry wells and to correlate the seismic horizons to the results from the wells. The Simeulue Basin is divided into a northern and southern sub-basin. Carbonate build-ups were found in the northern sub-basin only on the very shallow shelf in the north-east. The maximum thickness was determined to be ~ 3 s TWT. In the southern sub-basin carbonate build-ups (which were already identified on some lines of the SEACAUSE project), bright spots and Bottom Simulating Reflectors (BSRs) are wide spread. The narrowest basin surveyed was the Nias Basin. As the Simeulue Basin the Nias Basin is divided into two sub-basins which are separated by a structural high. Although the basin has a maximum width of only 55 km the maximum sediment thickness exceeds 5 s TWT. The largest fore-arc basin is the Siberut Basin. It extends from the equator to ~ 5°S over 550 km and has a maximum width of 140 km between the island of Siberut and Sumatra. The maximum sediment thickness in this basin is 4.8 s TWT. The basin geometry is uniform along its axis. At the basins termination on the western side to the Outer Arc High the Mentawai Fault Zone could be traced. The geometry of this major fault changes significantly along strike. In some areas it is traceable as one single fold whereas in other areas it spreads in up to three different branches indicating splay faults originating from a main fault. In the Siberut Basin BSRs are very wide spread and very good recognizable over the Mentawai Fault Zone. Along the Mentawai Fault and along the eastern rim of the basin the seismic data show strong indications for active venting. The morphology of the Sunda Trench and its sedimentary cover varies from north to south. In the north the trench is poorly defined with shallow seabed dip but with sediment thickness of ~ 3.5 s TWT. The seafloor dips increase southwards, but sediment thickness decreases to ~ 2.5 s TWT off Nias. Both the ocean basin and trench sediments are dissected by numerous normal faults with a maximum displacement of 0.6 s TWT. Along strike the deformation front between Nias and Siberut displays several incipient folds. As offshore northern Sumatra, both landward (BGR06-228) and seaward verging folds (BGR06-227) are developed at the deformation front. For the first time landward verging folds have now been imaged in this domain of the Sunda subduction zone. In contrary to first thoughts during the expedition SO186-2 SEACAUSE, landward verging folds are not limited to the area off Aceh. Two refraction lines were acquired parallel to the subduction front at 2°30'N and 1°30'S approximately 40 - 50 km seaward of Simeulue and Siberut Island, respectively. The lines were designed to identify the segment boundaries in the subduction system as well as to detect and decipher the subducted aseismic Investigator Ridge. The gravity data set consists now of over 38,000 line km (combining the GINCO, SEACAUSE I and II and the SUMATRA data). With this it was possible to compile a map of the free-air gravity from the northern tip of Sumatra (~ 6°30'N/95°E) to Mid Java( ~8°30'S/110°E). Gravity modelling in parallel with refraction seismic data interpretation was carried along two lines during the cruise. The preliminary results show that the incoming oceanic plate is unusual thin both in the north off Simeulue (6 km) and in the south off Nias (5 km).
Allgemeine Geschäftsbedingungen, siehe http://www.bgr.bund.de/AGB - General terms and conditions, see http://www.bgr.bund.de/AGB_en. Die bereitgestellten Informationen sind bei Weiterverwendung wie folgt zu zitieren: Datenquelle: SO189 SUMATRA 2006, (c) BGR, Hannover, 2019